A Clear Temporal GIS Viewer and Software for Discovering Irregularities in Historical GIS
July 18, 2013, 13:30 | Short Paper, Embassy Regents E
In order to use geographic information systems (GIS) to understand any aspect of human systems, researchers and teachers require a GIS capable of dealing with temporal information. Recognition of this need among historians, the humanities disciplines, and the historical social scientists extends back at least as far as the initial development of TimeMap (not maintained after 2007) in conjunction with the Electronic Cultural Atlas Initiative (ECAI) in the late 1990s. The project presented in this abstract represents a portion of a larger effort to improve spatio-temporal GIS by developing a database management system, Intentionally-Linked Entities (ILE), consisting of a data structure of direct linking via pointers, rather than storing data in tables, as in a relational database management system (RDBMS). We have taken advantage of linking information entities/objects directly to other entities/objects to create a better exploratory GIS viewer for those seeking to evaluate a large historical database.
When fully implemented the fully-linked data model such as ILE offers many advantages for spatio-temporal GIS. The model permits relationships with unlimited arity (number of roles) that are represented by direct links. Currently the RDBMS permits unlimited arity but relationships are not represented by direct links, whereas network/graph databases (such as the increasingly popular Neo4J (Anonymous, 2013) represent relationships with direct links but are limited in arity to 2. Additionally, network/graph databases have no means of representing entity sets, making them unsuitable for ontological inferences. High arity, direct representation of arity sets, and direct linking are all important attributes for representing and analyzing complex systems often found in the Humanities.
However, for purposes of designing a better temporal GIS exploratory viewer, the major technical innovation relates to quick, effortless searches through large amounts of data. The current standard GIS represent temporal data by means of time-stamping within an RDBMS, leading to much redundant data (Yuan and Hornsby, 2008). The RDBMS is inefficient for temporal applications because all queries require a database search, which is inefficient even with indices because temporal applications require frequent searches as the user moves from one time period to another. We have employed a direct-linking data structure with pointers so that NO searches are required during the display of data. No special work-around in data modeling or indexing is necessary to enhance data exploration.
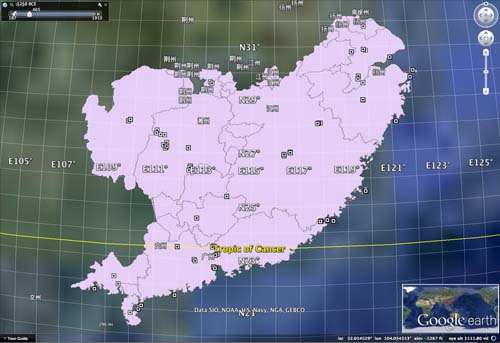
We used CHGIS (China Historical GIS) V. 4 (current version) time-series database as our test bed. This database is a good test bed because of the amount of data involved, especially when all seven input files are used at once. Moreover, CHGIS is the most accessible and logically designed of all current historical GIS (HGIS) databases available. Bol (Bol, 2007), director of Harvard’s Center for Geographic Analysis and CHGIS founder, wrote that the CHGIS database can be used as an authoritative historical database. Therefore it should be of great interest to be able to find and hopefully correct the errors or note the irregularities. CHGIS’ metadata indicates that the database is established on the datum North American Datum of 1927 (NAD-27), and we have used the Xian 1980, Transverse Mercator projection, which is the correct projection, for examining the relative positions of the provincial capitals and their boundaries.
We explored some of the available options for viewing temporal GIS data by starting with Google Earth. Berman (Berman, 1999), who engineered the pioneering data model and software for CHGIS, wrote, “Now we can browse through hundreds, or thousands of years of Historical GIS objects .... Interestingly, the temporal browsing functionality is only possible using a free software application, Google Earth ..., but cannot be done with any of the major commercial GIS packages.” We found Google Earth to be awkward and confusing. When used with the two time-series provincial data files of CHGIS, the display was often too messy to comprehend precisely. The labeling is very poor, with the names of the capitals showing only in Chinese characters unless we place the mouse over the placemark. Surprisingly, even though the time resolution of the CHGIS time series database is one year, Google Earth only seems to be able to display data sometimes every seven years (such as 373, 380, 387,...) and sometimes every eight years (there is a gap between 1490 and 1498). There are temporal points in the database itself that lie on years that Google Earth apparently cannot display. We attempted to set software preferences and to look in the database files, in vain, to see if there are instructions telling Google Earth to skip or not to skip years. We can only guess that the Google Earth designers skipped years in order to reduce the data handling load. Finally, when asked to animate the map by running through the years, Google Earth animates the map at a speed that is far too rapid for the eyes to comprehend, even at the slowest speed setting [1]. This is not too surprising since Google Earth was probably not created specifically for Historical GIS, and also because of the year skipping mentioned earlier.
We also tested ESRI ArcGIS Explorer on the time-series CHGIS data. Explorer behaves very strangely, however. When sliding the time slider to the right, the time did not always progress in the forward direction! For instance, starting from year 778, the progression in years for the ArcGIS Explorer was 778 - 780 - 786 - 784 - 786 (That's right, another 786!) - 864 - 804 - followed by a crash, which is something that occurs often, even on a powerful PC.
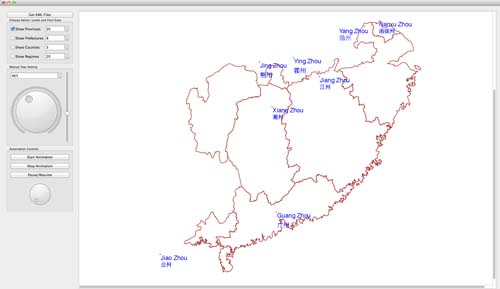
After these unsatisfactory experiences, the first author wrote his own HGIS viewer, Clearview, which displays the provincial boundaries and capital locations clearly. Clearview is also capable of displaying the data at every temporal point for which there is data. Additionally, Clearview’s automated display has a widely adjustable speed that allows slow enough settings for viewing comfortably by a user. Clearview also mines the html data in the place marks to display Pinyin names, and it can be modified to display whatever the user wants.
Due to the clarity of Clearview’s display, the user can clearly visualize the relative locations of provincial capitals relative to their boundaries. As soon as the user animates Clearview through time, it is immediately obvious that there are many instances of provincial capitals that are outside the respective provincial boundaries. Subsequently the first author wrote another piece of software, which goes through the entire CHGIS time-series provincial dataset and computes how many instances there are where a provincial capital lies outside the same province's boundary. This software found the following: 124 instances of the provincial capitals lying outside the same province's boundary, an irregularity (perhaps an error since normally a capital lies inside (or on) the boundary) compared to 420 instances in which the provincial capitals lies inside the same province's boundary. (An instance is a province together with a maximal period during which there are no changes in that province.) There are also three instances in which the provincial capital exists but there is no polygon for the corresponding province, which is not an error. There are also seven curious irregular instances where a province has two capitals the same year. In each case these two locations appear to be so widely separated, sometimes in different polygons. These may not errors since some are military governorships not provinces, but this fact should be in the database.
Getting Clearview to work on large amounts of data requires technical innovation. One way to achieve direct linkage from each time step in the database to all the objects to be displayed at that time step was covered in Kantabutra, et al. (2010). However, with the large amount of data in CHGIS, the number of links can be very large. Suppose a geographical object is valid for 1000 years, then the pointer scheme in Kantabutra, et al. requires 1000 links from the time objects corresponding to those 1000 years to the graphical object. For this viewer, we ameliorate the situation by using a data structure call the Tree of Time. This structure is similar to the Time Tree used for multiresolution video (Finkelstein, et al., 1996), but used differently.
The Tree of Time is a binary tree structure (Cormen, et al, 2007). The Tree of Time is indeed a search tree, but the only searching that occurs is done during the tree construction. When Clearview is running, no searching takes place because each time-object already has pointers to the tree nodes, whose time intervals contain the time represented by the time-object. Because CHGIS intervals are one year, that is the setting for this demonstration, but the Tree of Time can be used for any time resolution in a data set.
The Tree of Time is used internally and the user doesn’t have to deal with its complexity. The software for discovering data errors or irregularities also employs complex data structures in order to ensure correct and efficient enumeration of such situations.
A video about this viewer can be viewed at http://youtu.be/uZrn-hMlZXo