Visualizing Uncertainty: How to Use the Fuzzy Data of 550 Medieval Texts?
July 17, 2013, 13:30 | Short Paper, Embassy Regents F
Our research project Visualizing Medieval Places brings together a computer scientist and a literary historian. We use the web-based tool GeoTemCo (Jänicke, 2012) to visualize thousands of place names against a focusable timeline. The resulting geospatial-temporal visualization is a way for the researcher to analyze space and time in a historical corpus of literature. The ideal user interface will allow manipulation of the visualization by (1) dynamically changing the thresholds for both visualizing and suppressing given types of uncertainty in the geospatial and temporal dimensions, and (2) adding or removing facets (e.g. particular genres, time ranges) to broaden or constrain the amount of data to be displayed. This interactivity will hopefully allow for controlled visualization of literary data, and will facilitate the formation of nuanced, supportable hypotheses about time and space in literature. Figure 1 illustrates the current user interface.
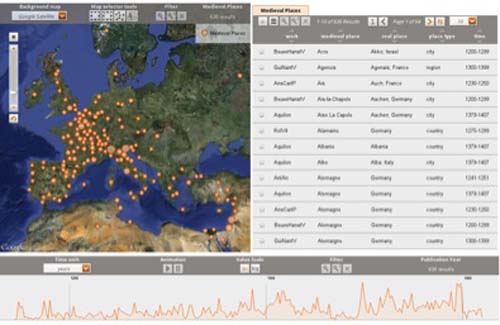
Figure 1:
The current GeoTemCo user interface, showing 636 data points from the Franco-Italian dataset. NB: The time line at the bottom does not represent the real temporal data of the project.
The data set is being built using a corpus of nearly 550 medieval French texts. Unlike English or Classics, scholars of medieval French have few electronic texts at their disposal. Furthermore, spelling variance of toponyms in medieval vernacular texts poses a significant challenge for any semi-automatic extraction. We are considering combining our geospatial data of French places with Latin place names to build a bilingual gazetteer for use by the digital medievalist community in the future. For now, the toponyms (and their variants) are being manually harvested from a canonical reference work, the Table des noms propres (Flutre, 1962); they are subsequently disambiguated and geocoded. Unlike narratologically-inspired digital literary geographies such as The Literary Atlas of Europe (Hurni, Piatti et al., 2012) constructed on close readings of fictional and vernacular spaces, the data model for Visualizing Medieval Places includes only real geographical place names. It shares more with the GIS-based analysis of unstructured texts found in the Lancaster University initiative entitled Spatial Humanities (Gregory et al., 2012). Since Flutre’s work does not fully represent the variety of textual communities and genres of medieval French, we are also extracting place names from name indices in selected critical editions. The first subset of data points from Franco-Italian literature is virtually complete. The project uses the crowd-sourced Archives de littérature du moyen âge (Brun, 2012) to enrich the metadata about the texts.
Using the data has proved problematic since so many aspects of it are uncertain. Situating the composition of medieval texts in a specific time and place can be at best speculative. Date formats of traditional scholarship have been represented in idiosyncratic ways (e.g. between 1095-1291, first half of the 14th century, before 1453). Likewise, the toponyms found in these works are difficult for various reasons: they are unmappable, they can refer to multiple places, or they designate ancient Greco-Latin or medieval geographical zones no longer found on the contemporary map.
The visualization of uncertainty is a hot topic in the visualization community. Despite a broad set of applications in this field, there are still no straightforward solutions for displaying multiple, overlapping kinds of uncertainty within one set of visual interfaces. Drawing upon a long list of uncertainty types (Griethe et al., 2006), a data item within our project might be said to embody two basic kinds of uncertainty. The first uncertainty is one of “lineage,” by which we mean the reliability of the text source. Certainty values for lineage can simultaneously affect the representation of data items in both dimensions, the geospatial and temporal. The second uncertainty is one of “accuracy,” referring to the granularity of place or time, that is, to the distinctly sized intervals in which a value can lie. Again, granularity impacts both dimensions, the geospatial (with units such as landmarks, localities, regions, countries, continents) and the temporal(years, eras, as well as upper- or lower-bounded time declarations). Unlike Rees, who primarily uses transparency to depict uncertain information (Rees, 2012), we need to investigate multiple visual metaphors that represent several dimensions of uncertainty in a clear way.
Visualizing distinct, overlapping geographic entities with different certainty values represents a major challenge for the project. Inspired by MacEachren’s overview of existing methods for the geospatial (MacEachren et al., 2005), we suggest testing pairwise mixtures of color hue, texture, saturation and transparency, as well as other features such as pop-up text, backgrounds and overlapping/non-overlapping shapes to encode lineage and accuracy uncertainties. Figure 2 demonstrates how we use different shapes to encode objects with distinct geospatial accuracies.
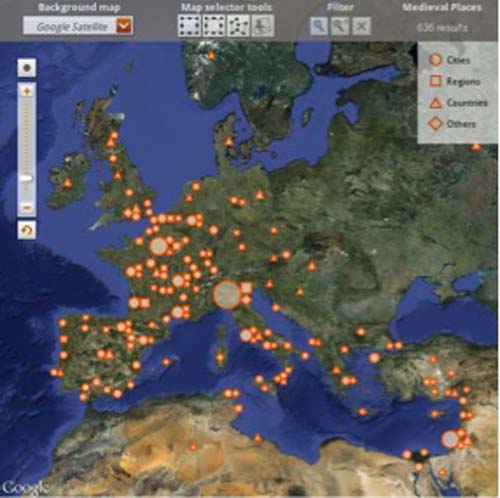
Figure 2:
A visualization of 636 points from the Franco-Italian dataset, with non-overlapping shapes denoting different toponym types.
Although some work addresses the problem of temporal uncertainty for small datasets (Zuk et al., 2005), sufficient research on large-scale temporal uncertainty is not available. Expecting thousands of overlapping temporal values of variable granularity on the timeline, we need to create novel visualization approaches. Figure 3 illustrates one solution for dealing with aggregated temporal uncertainty where increased saturation designates a higher degree of certainty. In our short presentation, we will demonstrate the tool and some strategies for simultaneous visualization of various aspects of the data.
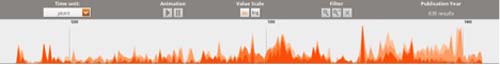
Figure 3:
: A timeline represented as a stacked graph with multiple aggregated uncertain temporal values (increased saturation designates increased certainty in lineage value). NB: The time line below does not represent the real temporal data of this project.
The project hopes to bring attention back to hundreds of unread works of the period (Moretti, 2005), perhaps even spawning new close readings of them based on their “interspatiality” — the common spaces that texts reference — but also to encourage students and scholars to experiment with visualizing spatial clusters and patterns