Possibilities of narrative visualization: Case studies of lesson-learned-oriented archiving for natural disaster
July 17, 2013, 13:30 | Short Paper, Embassy Regents F
Abstract
After the Great East Japan earthquake struck, the need for learning lessons from the vast amount of information has been increased in order for preparing the next Great earthquake. Therefore, the present study explores a method of displaying textual information of experiences and detecting narratives to learn lessons. We conducted two visualizations of database on the Great earthquakes and considered the outcome of each. We found that the outcome of one of the visualization was gaining factual information on phenomena, whereas the other that was designed to have future perspectives allowed to find the demands or views for the future as well as the facts in the past. If taking the perspective for extracting narratives and learning lessons, the outcome having future views is more contributing to gaining meaningful story. The future-oriented perspective would be recommended to add into the process of designing archive to learn lessons on natural disaster.
1. Background and purpose
As a means of succeeding collective memory, the social significance of digital archives has been increased. Since the Great East Japan earthquake in particular, organizations both in public and private sectors have created archives on the Great earthquake. As can be seen in numbers of archiving projects, large amount of descriptions, pictures, and movie images has been collected (examples seen in references section).
In creating archives, on the one hand, it is very important to preserve the whole and various kinds of information as much as possible. On the other hand, if considering the natural disaster will occur again, there is an emergent need to learn lessons from the experiences on the natural disaster and convey the lessons to the next generation in order to prepare for the next strike of the Great earthquake. As such, the issue here is to develop an effective way to learn lessons from large amount of information in archive.
One of the ways to learn lessons is focusing on narratives on the disaster and visualizing them. Narrative here is defined as the one having story line which is associated with time and space. According to the Bamberg (2012), when people do storytelling, the narrators “position characters in space and time and, in a broad sense, give order to and make sense of what happened” (85). In applying this into the context of visualizing archive, it would be beneficial to extract the time order and things making sense in order to learn lessons that are supposed to be something making sensible and meaningful. The present study, therefore, explore a method of displaying textual information of experiences and detecting narratives to learn lessons. More concretely, we conduct two visualizations of database on the Great earthquakes and discuss the outcome of each from the perspective of leveraging information in archives.
2. Case studies
2-1. Study 1: Visualizing information database of the Great Hanshin-Awaji earthquake
We visualized the information database of the Great Hanshin-Awaji earthquake of 1995, which was created and published by the government of Japan (Cabinet Office, Government of Japan, 2006). The database included textual information in relevant articles to what happened in local places within the Hanshin-Awaji area in Western Japan from 1995 to 2005, 10 years after the earthquake. These articles were classified into four periods. Details on the data were presented in Table 1.
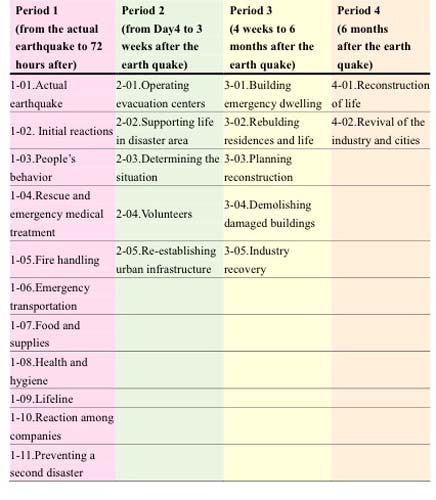
Table 1.
Content structure of articles in the information database of the Great Hansin-Awaji earthquake (from Cabinet Office, Government of Japan, 2006)
For the visualization, we utilized KACHINA CUBE (KC) system that is a web-based platform allowing to store, plot, and display information in three-dimensional space (Saito, Ohno, & Inaba, 2009; Ohno, Saito, & Inaba, 2010). Manually inputting data on the Great Hanshin-Awaji earthquake into the KC system, we designed the KC output which contained a 2D geographical map of the Hanshin-Awaji area, and a time line on the vertical axis. Segmented textual information from the database was plotted as information fragments into three-dimensional space. More concretely, the textual information including names of municipality was plotted in the space where a municipality was given a particular coordinate. Information fragments in each time period had each color. A total of 1,000 fragments were created in the KC system.
The KC system operated on three main functions (Figure 2). First was to access the original articles in the database by clicking information fragments plotted as segmented information. Second was to allow the cube in the system to rotate so that viewers could locate each information fragment on the map according to time period, at different angles. Finally, the system was equipped with a search function to retrieve the information that was specifically interested in by the users.
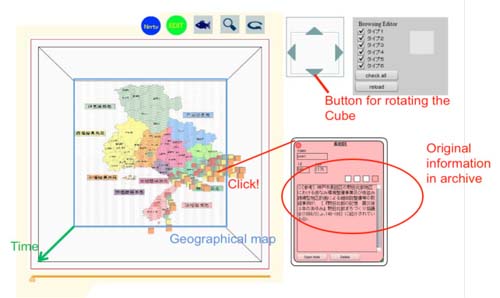
Figure 1.
Visual image of KACHINA CUBE output (as seen from the top) and its functions of rotating and accessing original information of a fragment
One of the outcomes of the visualization of the study 1 was inferred by paying attention to this quantitative distribution of articles in the geographical map. Comparing the number of articles across particular places and time periods reveals how textual information on the Hanshin-Awaji earthquake was accumulated. Few information fragments were related to the Nagata area in periods 1, 2, and 3 (Figure 3). During these periods, the Nagata area experienced the most damage, with the large number of houses destroyed in Kobe city (City of Kobe, 2010). However, the Nagata area did not have as much information as Nishinomiya city or Ashiya city which is close to the Nagata area. Thus, we could hypothesize that gaining information from severely damaged places was more difficult.
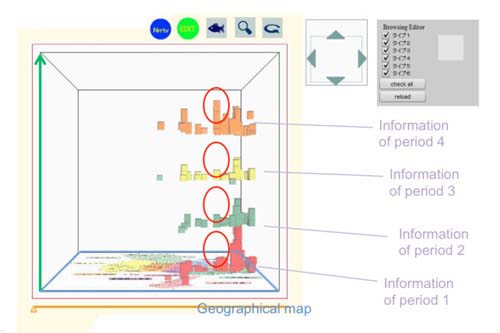
Figure 2.
The quantitative change in information fragments related to the Nagata area from periods 1 to 4. The fragments in red circles are the articles on Nagata area in each period (the KACHINA CUBE system as seen from the front)
2.2 Study 2: Visualizing the survey data on the Great East Japan earthquake
We also created a 3D visualization of the free textual responses in a questionnaire survey data on the Great East Japan earthquake by using the KC system. The survey was conducted by Kashima city, which is located in Ibaraki prefecture in the east coast Japan. The aim of the survey was to preserve and hand down the experiences on the Great East Japan earthquake to next generation and to gain useful information for making a disaster prevention plan (Kashima city, 2012).
As the target and database of the visualization, the textual information of the responses in the survey was sorted and organized into 14 areas in the city. The textual information of the responses was also separated and organized by the time periods of past, present and future. Showing the definition of the time periods, textual information in the past includes the experiences when the Great earthquake happened, the one in the present includes the experiences when people are in evacuation center, and the one in the future includes the demands or wishes for the future in relation to the earthquake. The contents of the textual information included the descriptions of the situation immediately after the earthquake, the behavior and actions taken in evacuation, recovery of infrastructure and procurement of foods and goods. An example of the table in the original survey report was in Figure 3.
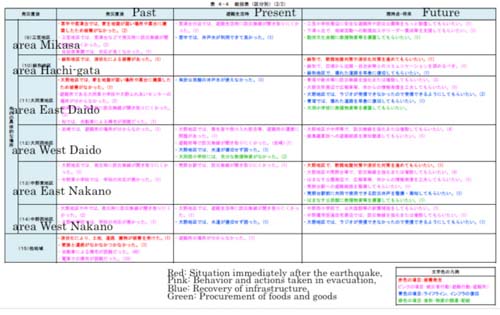
Figure 3.
Part of table including textual information of the participants' responses (In the figure above, the textual information was sorted and organized by time periods and areas of the city, and by colors for showing each of contents)
For the visualization, we utilized the KC having a 2D geographical map of the Kashima city, and a time line on the vertical axis. One area had a particular coordinate in the space of the cube, and the textual information as information fragments was manually put into the space of each area. The color of the information fragments was classified according to the contents of the information as in the Figure 3.
Similar to the outcome of the study 1 above, the lopsided gathering of information fragments was seen in the study 2. Taking an overview to the distribution of information fragments in KC, the quantity of information fragments in future time period was larger than those of the other time periods (Figure 4 and 5). In order to understand why the quantity of information fragments was larger in the future time period, we focused on the Hirai area where the tendency was remarkable and explored what was happening in each time period by accessing the original texts in KC. As the results, in the past time period which was immediately after the earthquake hit, we could find a voice in an information fragment that presented the experience of feeling difficulty in catching wireless broadcast for evacuation in Hirai area. There was also a voice showing that it was unclear of the primary school as an evacuation center. Even in the present time period in the life in evacuation center, a voice showed that it is not easy to catch wireless broadcast clearly. In the future time period, there were voices showing the participants’ demands of giving clear pictures of evacuation routes to evacuation center, keeping evacuation route in good condition, setting evacuation center to the familiar or close place and conducting a disaster drill. From these results, we were able to recognize the possibility of the rise in the citizens’ awareness of disaster evacuation in Hirai area.
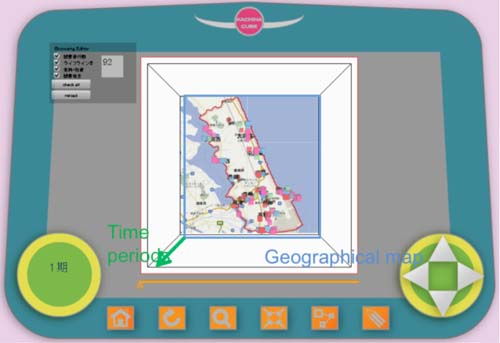
Figure 4.
Image of KACHINA CUBE output in the study 2, as seen from the top
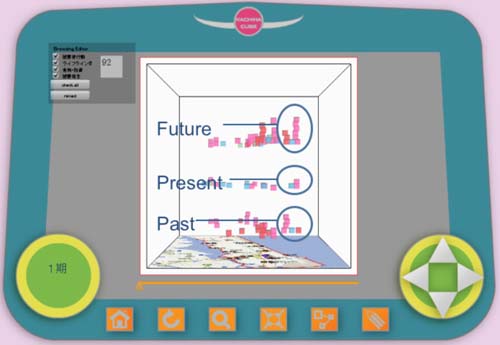
Figure 5.
The quantitative distribution of information fragments in Hirai area in each time periods.
3. Discussions
The outcome of the visualization of the database on the Great Hanshin-Awaji earthquake was gaining the factual information on phenomena, whereas the visualization of the survey data in Kashima city on the Great East Japan earthquake allowed us to find the demands or views for the future as well as the facts in the past. If taking the perspective for extracting narratives and learning lessons, the outcome having future views is more contributing to gaining meaningful story. As presented in the visualization with the survey data in the study 2, therefore, the future-oriented perspective would be recommended to add into the process of designing archive, in order for leaning lessons for the next natural disaster.
In addition to the suggestion of future-oriented archive for gaining lessons, the uniqueness of the present study is having both processes of extracting and displaying stories or narratives in visualization. As equal to conveying stories with visualizations (e.g. Segel & Heer, 2010), extracting the stories or narratives from the vast amount of information would also be important to effectively leverage textual information in archive. The visualization with the KC system will be also useful as a web-based visualization tool for supporting the research collaborations or interactions such as Heer and Agrawala (2008)have pointed out.