Lost in the Data, Aerial Views of an Archaeological Collection
July 17, 2013, 08:30 | Short Paper, Embassy Regents E
Introduction
A guiding principle in digital curation is that continuous management of data renders digital collections sustainable for continuous access and reuse (Higgings 2008). This assumes embedding data organization, documentation, and preservation practices in the research process, ideally from inception, as well as the persistence of resources to support past, current, and future technologies. In reality, these goals remain unattainable for many projects, especially those with long histories. Large gaps must still be bridged to build solutions to accommodate the realities of contemporary humanities data (Borgman, 2009).
Humanities projects can be long and multi-faceted, leading to convoluted collections that reflect technological and methodological changes over time. Researchers tend to adopt new technologies to solve specific problems and intend to deal with preservation later. Meanwhile, technologies evolve, putting data at risk. Research can be segmented due to funding constraints, changing teams, and new domain directions, making it difficult to enforce standards and achieve consistency. This is especially true in archaeological research, where fieldwork is cyclical and produces huge and complex datasets (Kansa, el al. 2011). After decades of accumulating data, it is easy to become lost in one’s own collection, wondering how to make sense of it all (Trelogan et al. 2010).
While initiatives are developing (Open Context 2012; Richards 1997) to help projects prepare data for centralized repositories, there is still a dearth of tools for on-the-fly management of evolving datasets with a long history. Here we present a visual analytics tool that provides an “aerial views” of digital collections and tools to help navigate the curation process.
We present a case study that adds new functionality to a visual analytics application designed for archival analysis with support from the National Archives and Records Administration (Esteva, et al. 2011; Xu, et al. 2011). New developments provide intuitive guidance for users with large collections in need of intervention without interrupting the flow of active research. New functions include tools for locating and sorting primary data, identifying duplicated and corrupted files, and creating timelines of production. It provides a toolkit for investigating formation processes in order to inform future plans and establish priorities for a collections’ documentation, preservation, and archiving. While this concept may resonate well with archaeologists familiar with the importance of formation processes and multiple viewpoints for analysis, the tool has wide application for any kind of disparate data with a long, continuing evolution.
Project Background
This study consists of an active collection of over 1,000,000 files from investigations by the Institute of Classical Archaeology (ICA) at the University of Texas at Austin, representing over forty years of research activities. It reflects the technological changes that have affected research since the mid-seventies, as well as the methodological and theoretical changes that have influenced archaeology and associated disciplines. The data are typical of a large archaeological project, from scans of photographs, drawings and field notes, to GIS datasets, 3D visualizations, and databases. Adding further complexity, ICA’s multidisciplinary approach has resulted in data amassed by generations of scholars and students, reaching across disciplinary, geographical, and political boundaries, each with its own set of methods, questions, and solutions.
As ICA’s focus has recently turned from fieldwork to publication, an increasing sense of crisis has arisen as researchers attempt to retrieve, assimilate, and share digital resources for study and dissemination. Past efforts to organize and document this collection have been piecemeal and have lacked consistent conventions for file naming, metadata, or organization. Data previously distributed throughout hard drives and detached storage devices have been consolidated in a networked server, but remain in serious disarray.
Help was sought from the Texas Advanced Computing Center (TACC), which provides high performance computing services, including data management support. Starting in 2009, the teams began a collaboration to assess and organize a sample dataset from one of ICA’s excavations (Esteva, et al. 2010). Work has since expanded to assess the entire collection, with goals to develop data management strategies that can be adopted without interrupting ongoing research, to document and archive the collection in TACC’s storage infrastructure, and to provide web access for collaboration and dissemination. Here we describe new functionality and promising results with the initial triage of the collection using the visual analytics application discussed above.
Methods
The application uses file system and file format metadata extracted from files and directories to create a visualization of the collection, akin to aerial photographs that provide encompassing views of a landscape from above. File paths and sizes represent the collection’s organizational structure as a treemap (Shneiderman 1992), and file format metadata is further classified using PRONOM’s file categories (PRONOM 2012) to narrow the information to a comprehensible amount. File classes are rendered as colored distributions within the collection’s structure.
In the background the extracted metadata is computationally analyzed and aggregated at different directory levels, and the results are written to a comma-separated table processed for display by the visualization. Users can interact with the visual representation of the collection by navigating directory levels, searching directory names, browsing, and selecting directories for observation. They can also select and group metadata using filtering functions. Tag clouds showing directory and file names, color and file class maps, and charts representing numbers of files per class allow users to verify and clarify the collection views.
File Class Analysis
In this project, for purposes of understanding the contents of the collection in relation to research stages, file classes are further categorized as: 1) primary, 2) process, and 3) publication data. Raster images, for example, are more likely primary data (e.g. site photographs), whereas vector images are more likely illustrations for publication. These categories were mapped to contrasting color maps, allowing for quick visual identification of directories according to classes and categories of the files they contain (Figure 1). Figure 1 is a view of the entire collection represented as a treemap showing file classes.
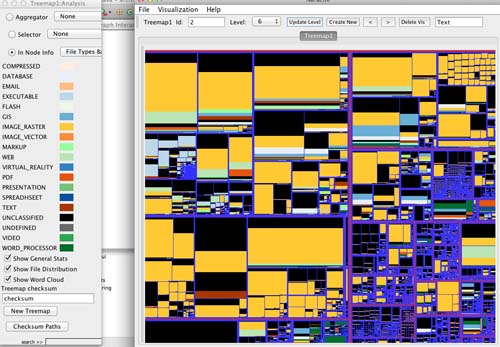
Figure 1.
5tb of archaeology data are represented as a treemap. The predominance of raster images across the collection, as well as primary, process, and publication data can be identified.
Directories can be further explored via search and browsing functions to refine the assessment. One useful discovery was a large collection of artifacts left over from obsolete operating systems and software. Using the directory labels search function we located a large collection of raw digital photographs that had been thought lost. Consequently several areas of the collection were identified as priority for archiving and others for disposal.
Checksums and Date Analyses
A checksum analysis function was developed to aid identifying corrupted and duplicated files. Identical checksums are rendered in the directories where they are located. Through this function we found that identical checksums can exist in large quantities (over ~5000 in this archive). Those are likely to belong to error messages, empty strings, cache artifacts and similar images made by databases for speeding retrieval, are generated automatically, and can span many directories. This led the team to find multiple copies of old web-based databases to mark for deletion. Instead, checksums for duplicate files likely created by copying files or directories, are generally distributed across only two or three directories. Several sets of duplicated files were located and marked for deletion, freeing up space and allowing a clearer picture of the collection.
In analyzing repeated checksums, associating them with file class information aids in deciding if they should be kept or deleted. In addition, learning the complete file path allows identifying if these are temporary files, svn-related, duplicates, backups, and their provenance. The location of these files and their distribution are indicative of the archive's formation process and can lead to clues about associated data (Esteva 2008).
We are working on incorporating dates into the analysis so that file classes and checksums can be viewed in a timeline. Last modified dates will be aggregated by year and shown in relation to file classes. Users will be able to select viewing features and amounts for a given year [1] , and many treemaps can be opened at a time to allow comparison of technologies in a timeline.
Much like in archaeological excavations, the knowledge brought by various experts regarding the collection’s history, work processes, workflows, and technological change, aids in understanding the collection’s context and planning for its preservation. With these tools, we are able to “dig” through the archive much more effectively and gain a clearer picture of its content and significance.
Conclusions
This application provides a framework to study collections with interactive tools for discovery, condition assessment, and a roadmap to make inferences about the processes by which they were formed. It has wide-ranging implications for collections that must be explored from multiple viewpoints — as with archaeological landscapes — in order to understand their condition and plan their future trajectories.
A work in progress, the tool requires further development from multiple ends. Presently, not all file formats can be identified and the file classes may be too broad for the study of specific datasets. Ideally, the tool should be implemented to update dynamically for purposes of continuous monitoring of active collections. We will illustrate the presentation with images, report findings, and will discuss functionalities and the challenges ahead.
References
Notes
1. The assumption is that last modified dates are valid for analysis, which is the case in this study collection.